I’m writing this post, not from a position of expertise, but from trying to figure out a challenging problem. At Trig, we follow the Entrepreneurial Operating System (EOS) discipline of updating a scorecard with key performance indicators that reflect how the business is performing on a weekly basis for our Level 10 meeting. So far, we have been using a simple Google Sheet that is shared with the team to assign who is accountable for each number and track progress. The process has elements of subjectivity to it as some numbers like client net promoter score are far more valuable when associated with the stories behind the number. Other, more routine numbers like individual project budget tracking are tedious to generate and some automation would be beneficial.
Business Intelligence Scorecards
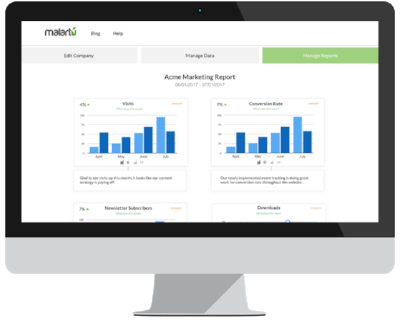
There are a number of business intelligence solutions out there that aggregate data from the major business software packages. Having shopped several, we are thrilled with the Malartu Dashboard tool for being able to provide secure dashboards for general team reports and individual KPI tracking. Designing these dashboards has been a lot of fun, but a chapter from Charles Duhigg’s book, Smarter Faster Better gives me pause on the long term benefits of fully automating our scorecard.
Data Disfluency
Duhigg introduces the idea of data disfluency as the best way to absorb information. We can’t passively accept information as it comes at us, but need to transform it into experiments to test ideas. By making data harder to interact with, or more disfluent, we paradoxically make it easier to understand. In Chapter 8, Absorbing Data, we hear about the turnaround of the well funded yet failing South Avondale Elementary School In Cincinnati Ohio. The teachers had amazing dashboards of data at their fingertips for each student, yet admittedly never looked at the data. The turnaround came about through use of data rooms, where teachers were required to manually track test scores. It was only through sifting through the data manually that trends emerged that could be addressed through targeted education activities. This disfluent approach to sifting through data and experimenting with changes to how students are taught in response to those insights led South Avondale to go from one of the worst performing schools to one of the best in the district. When we encounter new information, we should force ourselves to do something with the data. Duhigg advises, “If you read a book filled with new ideas, force yourself to explain them to someone else to be more likely to apply those ideas in your life.”
The Malartu dashboards are beautiful, and we are getting insights to our business that are confirming hypotheses we only dreamed of validating before. But, are we becoming less disfluent? How do we maintain our design thinking mindset with our scoreboards when the data crunching is done for us in a fraction of the time?
A Beautiful Machine Learning
In Principles by Ray Dalio, Ray reveals that Bridgewater’s dashboards are so sophisticated that he might almost be able to run the 1000+ person firm through the data alone. Ray, the individual, is so freakishly data savvy that he would feel comfortable with the beautiful machine he has designed. Of course, this becomes a problem as he has transitioned out of the CEO role and put someone else in charge of his beautiful machine, with mixed results. Having read his book, I would be fascinated to hear how Ray would respond to the idea of staying disfluent with your data vs the artificial intelligence tools that Bridgewater uses to evaluate the markets as well as their internal metrics.
At some point, the data sets you work with get so complex as to be impractical to manually force disfluency and crunch the numbers by hand as Duhigg suggests. A static dashboard that displays a flat series of graphs to a team member is equally impractical since they can’t interrogate the data further to drill down into the “why” of a problem.
Simple
I am reminded of Jocko Wilnik’s chapter 6 Simple, from Extreme Ownership where he and Leif are consulting to a management team that was having trouble getting their employees to understand their incentive program. They teach that needless complexity of a plan or communications will compound issues when things go wrong. If the team doesn’t understand, the plan will fail. The incentive program in the case study was far too complex to be understood and plant productivity was flat. After being challenged to simplify the plan, the management team reduced the variables down to two and limited the variability to weekly changes. The application of the Simple principle led to a significant improvement in productivity and a clear understanding of who the low performers were in the plant.
With great power comes great responsibility.
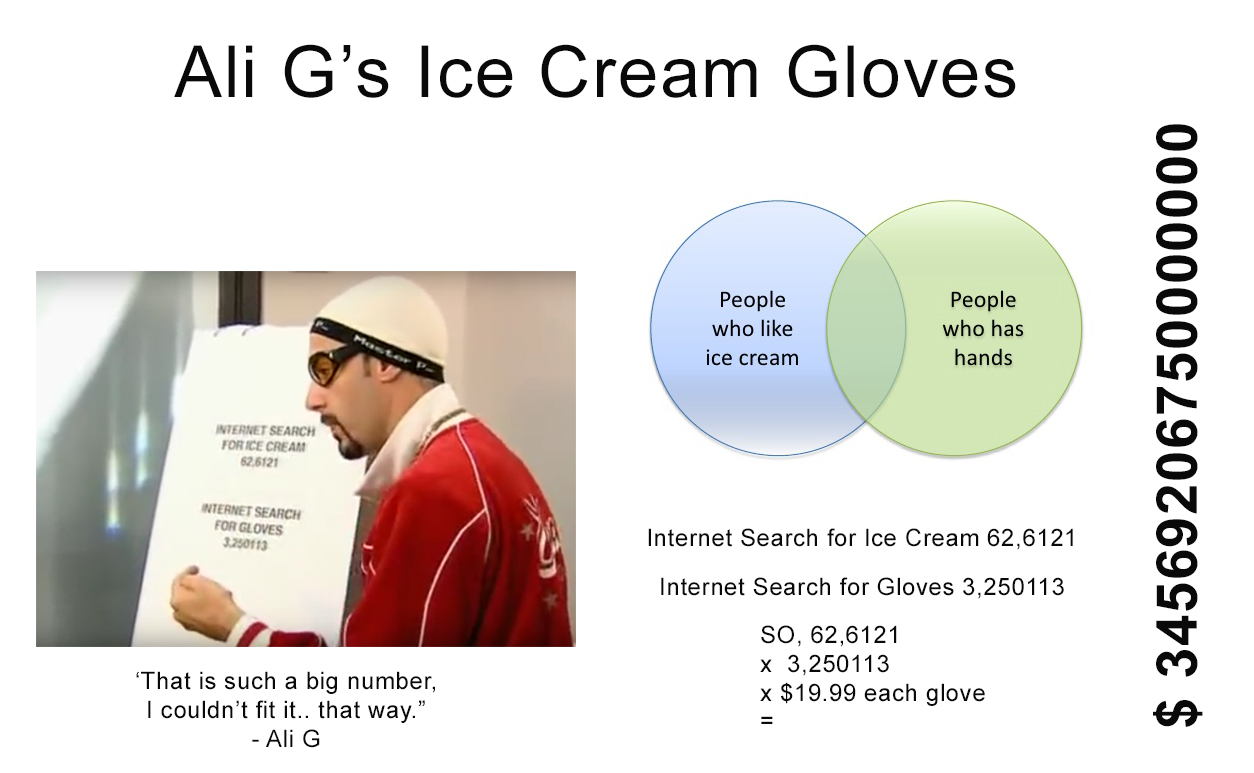
The risk of using a tool like Malartu is that we now have the ability to design highly complex metrics that obscure the data from a disfluent engagement by team members. We could measure the number of Slack messages and multiply by utilization rate, website traffic, and any number of other metrics to arrive at an aggregate number. However, be aware that any good data scientist will ridicule your attempts at mixing two units of measure. You are very likely to deceive yourself through such methods, as Richard Feynman points out, "...you are the easiest person to fool."
“The fundamental job of a leader is prediction. At the heart of a leader’s ability to predict is data - and lots of it.”
— W. Edwards Deming
Automated data analysis shouldn't replace human-gathered intelligence for the same reasons that both qualitative and quantitative customer research methods are used. Leaders should be talking with customers and employees on a weekly basis then synthesize to make sure a company of any size is staying aligned with the market. Data collection doesn't need to be overwhelming as employees and customers can pitch in when given the right tools. Good disfluent analysis of complex data sets, therefore, comes through regular engagement with the data, actively interrogating it in search of new insights, then using those insights to form experimental predictions of the future. Like good Design Thinkers, we set up low-risk experiments to validate or refute the strategy, then measure the results and start the process over again. This process describes the uniquely human ability to find the “next adjacent possible” that is outside the capability of any artificial intelligence.
At Trig, we integrate data analytics across our creative process. From quantitative survey techniques to ideation metrics to marketing revenue attribution, we help our clients make better decisions.
The Trig Team sometimes likes to go stealth. Engage stealth mode.
LinkedIn